
Creo Vision · Vision AI and dashboards
Your numbers, explained.
Creo Vision turns the data your business already collects into dashboards your team reads in a minute, and answers the follow-up questions in plain language.
Customers log in to see their own dashboards.
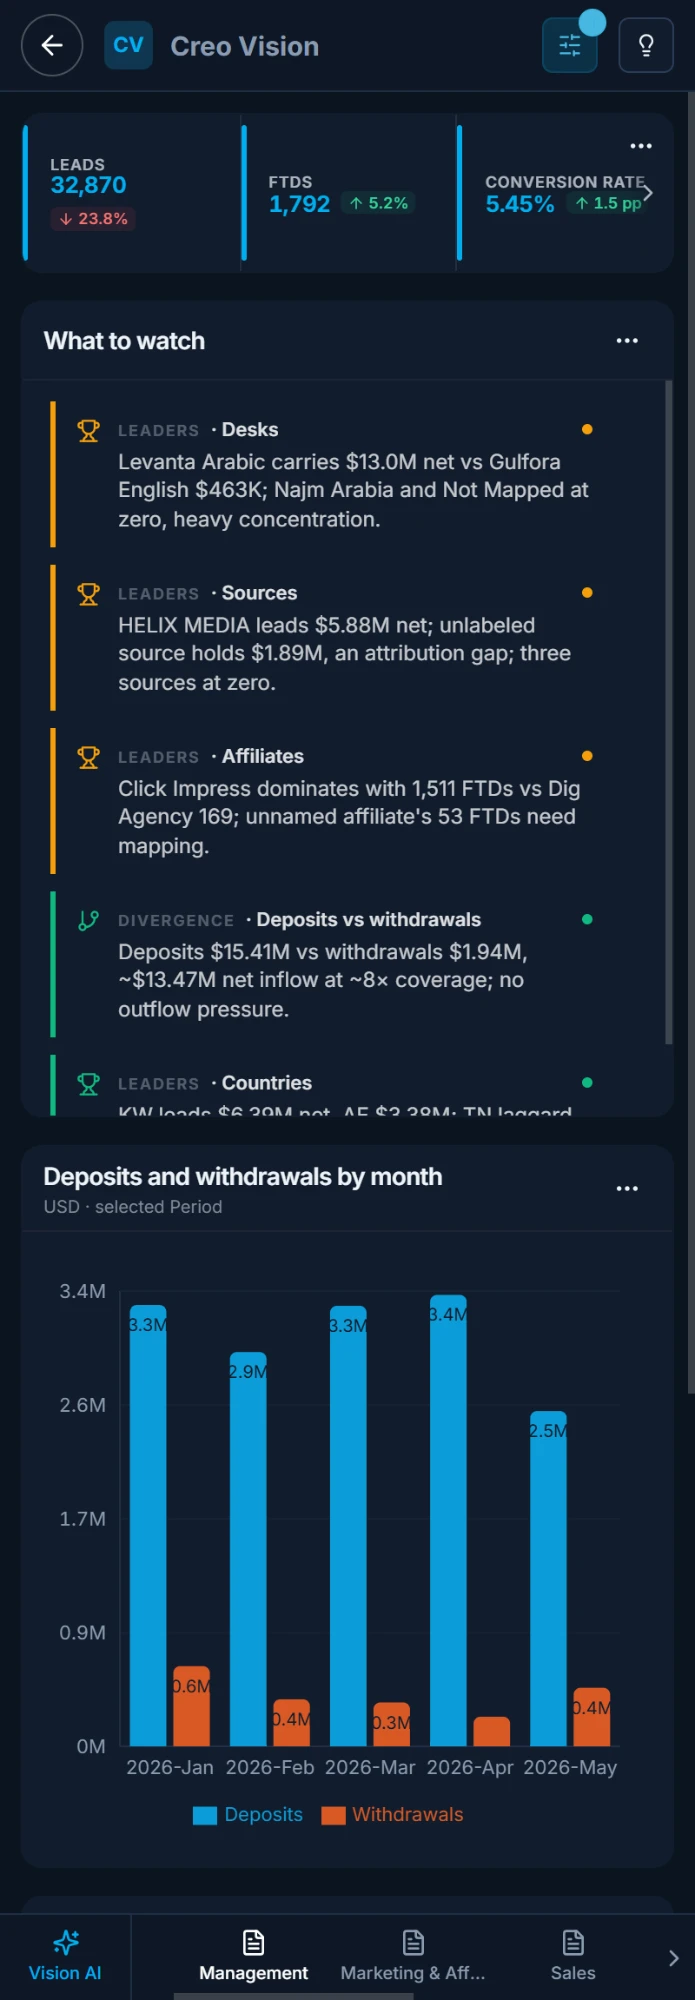
Walkthrough · 30 seconds
See Creo Vision in half a minute
Vision AI
How Vision AI works
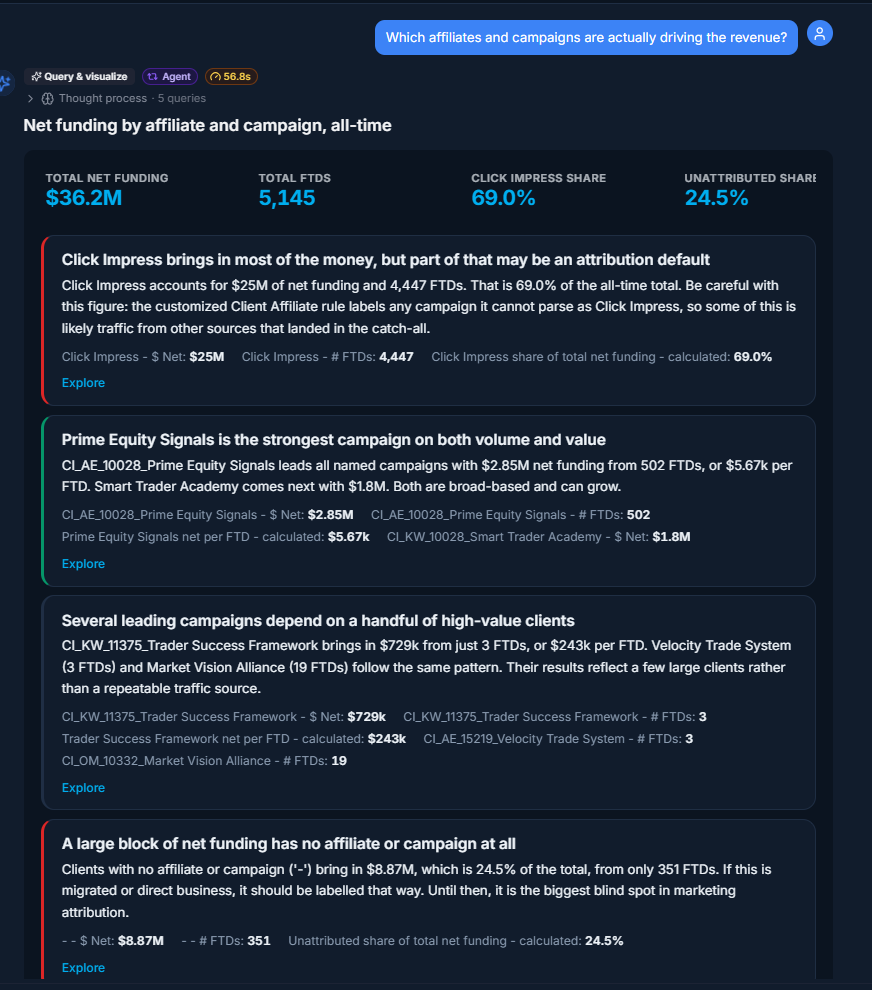
Vision AI is the analyst inside Creo Vision. You ask about your company's data in plain language; it queries the data itself and answers with figures you can check.
-
Step 1
You ask in plain language
Type it, or start from a chart, a page or an insight.
-
Step 2
Vision AI queries your data
The same data as your dashboards, inside your access.
-
Step 3
You get an answer you can check
Key figures, a chart, a table, and the data it is based on.
-
Step 4
Keep it, follow up, or repeat it
Save it, ask the next question, or have the analysis repeat.
Four ways to start a question
-
Your own question
Type it on the Vision AI tab.
-
From a chart
Analyze with Vision AI.
-
From a page
Analyze this Page.
-
From Smart Insights
Ask what is behind an insight.
Built to be checked
-
It names its data
Each answer says what it used.
-
Inside your access
A team lead gets their team.
-
It only reads
It cannot change your data.
-
Figures behind the text
Key figures and a table.
Shape, keep and export
Choose the shape of the answer: Auto, Brief, Full report, Visual or Just the numbers. Save an answer to open it again on today's data, or export it as a PDF, as data (CSV or Excel) or as a chart image.
What you get
One place for the figures that run the business, and a way to question them
-
Ask in plain language
Type a question. Vision AI queries your data and answers with a chart, a table and a short explanation. Save the answers you want to keep.
-
Dashboards built for your business
Key figures with the change against the previous period, charts, tables and funnels on your own data, in your brand. Every dashboard has a guide that explains each number.
-
Analyses that repeat
An analysis defined once runs again on fresh data: findings, recommended actions, and a check on whether earlier advice worked.
-
Smart Insights
A page can point out what changed and what needs attention, so you start from the exceptions instead of scanning every chart.
-
Each person sees their part
Access is set by dashboard, by page and by data. A team lead sees their team; a manager sees the whole picture.
-
On the phone too
Pages laid out for a phone, with an icon on the home screen. Export a chart as an image or an analysis as a PDF.
Examples
What a user does after logging in
Two more screens from the CreoLabs demo dashboard. Your dashboards show your own data.
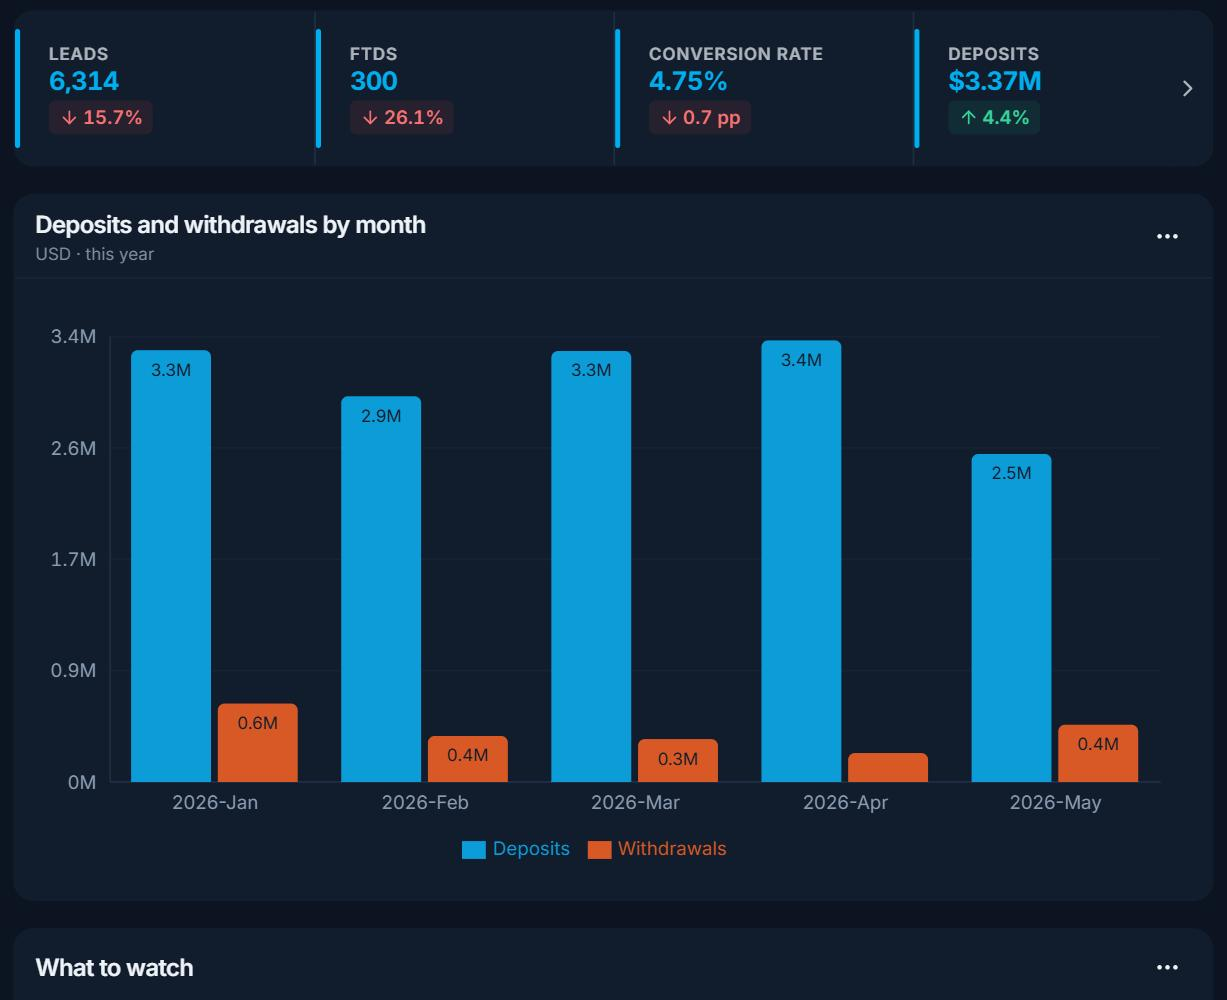
Dashboards
The state of the business in a minute
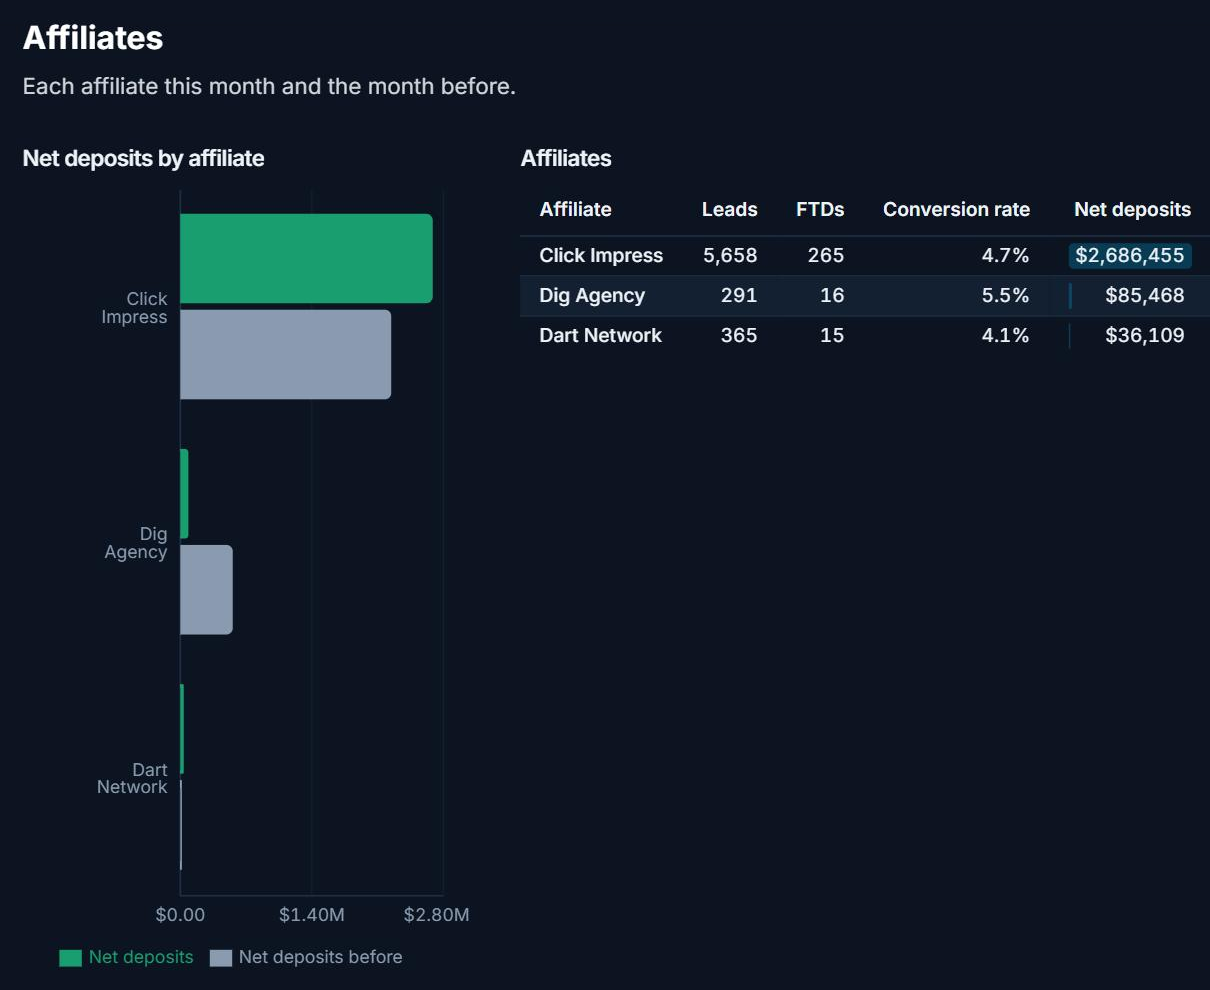
Key figures with their change against the previous period, then the charts behind them. Filter by country, affiliate, source or desk.
Demo data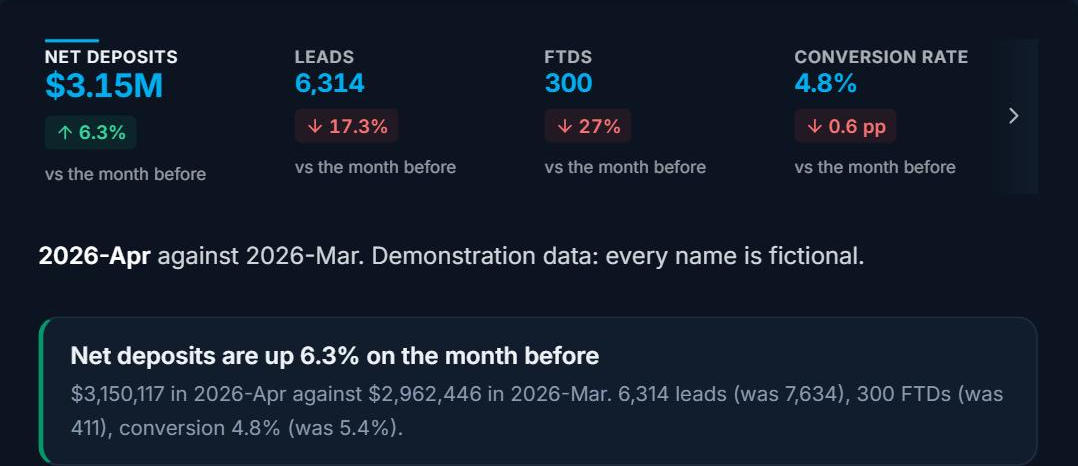
CreoLabs analyses
A review that writes itself every month
Key figures against the month before, the findings in plain words, then a chart and a table for every part of the story. It also says what to do, and checks whether last month's advice worked.
Demo data · two parts of one reviewHow it works
Three steps to your first dashboard
-
We connect your data
Your systems are loaded on a schedule into Creo Sense or Creo Media, with one agreed definition for every figure.
-
We build the dashboards with you
Pages for each role, in your colours and with your logo, each with its guide.
-
Your team logs in
Everyone opens their own dashboards, asks follow-up questions and gets the same numbers.
Creo Vision is built on Creo Sense and on Creo Media.
They hold the data and the definitions behind every figure: Creo Sense for brokerages, Creo Media for marketing companies. Short guides for users are on the Creo Vision page, with no login needed.
See it on your own data
Ask for a walkthrough. We show the product on demo data and discuss what your team needs.